Tech: CurrentCost
In what was a project that got me started on home power monitoring, this was my first real attempt at making something that would be usable by others (and actually was).
Working with enterprise hardware on a daily basis opens your eyes to how much electricity IT equipment actually uses (not to mention how much heat they generate). After working on a project to help track the power usage of the equipment we had in our lab, I became curious as to how much electricity I was using at home.
At the time smart meters didn't exist, and home monitoring was still in its infancy. A few devices existed to give you inline readings, and even fewer for monitoring the whole house. Thankfully, a device called the CurrentCost was available that using a clamp around the live wire of your house would transmit your power usage in near realtime to a receiving device (a LCD screen).
Having a screen that shows you the power you are using isn't really worthy of an article, however there is more to this than just seeing that my 3am oven-roasted chicken consumes electricity (and increases my waistline). The CurrentCost had one additional party trick, in that with an extra cable you could collect the readings via USB.
One cable later and I was on my way to capturing the readings from the device. It was a simple setup at first, however I wanted something more functional. For starters I wanted a simple web interface that would show me in realtime the power usage (in chart form). On top of that, I wanted a way to log the data somewhere persistent where I could actually see a difference over time.
Tackling the first part proved to be somewhat entertaining, with it being an interesting exposure to programming in C (properly this time). After many failed compiles I finally managed to have a working mini web server that hosted some very simple HTML/JS and continuously read from the USB port to get the live data. It was incredibly slim and ran beautifully on the Bifferboard (for multiple people).
Tacking the second part required switching to a different programming language (for my sanity). Somehow I landed on Perl for this task (looking back I question how much I had drank when I made this decision), which was configured to poll my shiny C web server for the readings and then upload them to Google PowerMeter (sadly now demised). After some code tweaks it worked like a charm, uploading my readings periodically and giving me a view over weeks/months.
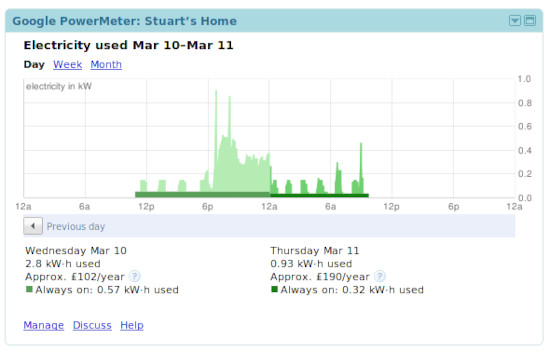
One of the testing screenshots from Google PowerMeter
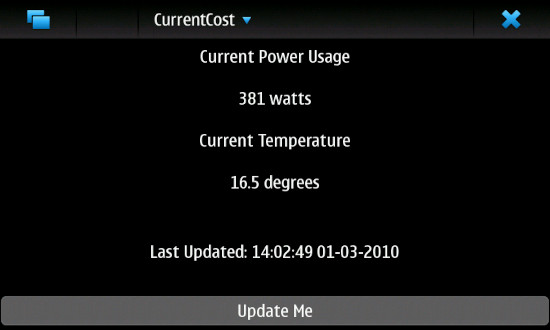
Stats from my Nokia N900 phone (a blast from the past)
After the code was live for some time and was being used by a few brave people, I actually managed to make Hackaday. A few more downloads of the code after that which was a nice touch. I will admit feeling quite proud after seeing an article about it.
As for now, my monitoring changed a few times over the years and I currently use the Brultech GEM to monitor the different circuits in the house (rather than just the whole house).